 Photo Credit: Christian Colen
How to Measure Big Data and What It Can Tell Us
This final blog will explore some of the methods that are currently in use for understanding the vast sums of data on the internet. Analysis of big data can help public diplomats gauge online sentiment and reaction to initiatives, as well as identify public influencers.
Sentiment Analysis
Definition: The process of deriving emotion and opinion from a data set.
Purpose: Help diplomats understand how initiatives, policies, and posts are being received by the target audience. This has obvious benefits for public diplomats who hope to turn large data sets into decipherable and useful information.
How it Works:
- Computational Natural Language Processing (NLP) uses algorithms to understand and process human language.
- NLP uses keywords (love, wonderful, best vs. worst, stupid and waste) to code tweets as positive, negative, or neutral.
- These programs also take into account proximity to words that negate sentiment, like aren’t isn’t, and not.
Example: Cyber Activists in Iran
- A London-based group of researchers used sentiment analysis following the 2003 Iranian Presidential elections to make sense of the all of the user-generated input on Twitter, Google+, and blogs.
- They found that the Iranian Administration had vastly overestimated support for former President Ahmadinejad.
- This is an example of big data providing direct access to the people, as opposed to having the public’s opinions filtered through an Administration that may have a motive to misrepresent. The ability to accurately ascertain public sentiment can help the US create more effective foreign policy.
Network Analysis
Definition: A mathematical analysis that helps to visualize relationships between interacting units.
Purpose: Provides a visual representation of vast amounts of data points that would otherwise be too complicated to understand. Network maps show diplomats and MFAs who’s interacting with their content the most, identify groups that are discussing relevant issues, and reveal local influencers.
How it Works:
- Network maps are generally created by drawing lines between interacting units to create a visual representation of a network.
- On Twitter, an interaction consists of a retweet, a like, or a reply. The thickness of a line will depend on the number of interactions
- Network analysis can be done for specific people (President Trump, Pope Francis), or on specific communities or hashtags.
Example: Polarization in Egypt
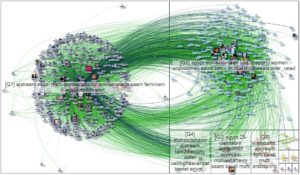
- Network maps of the Egyptian population during the 2011 crisis showed that the electorate was very polarized.
- Understanding the dynamics on social media allows the US to craft policy that better achieves its goals by incorporating foreign public opinion. Ideally, listening to social media users could also help policy makers foresee how events might play out in the future.

This network map was creating using NodeXL, a popular online network mapping tool.
Example: Pope Francis as a Message Amplifier
- In 2014, The UK Foreign and Commonwealth Office created a network map following a Global Summit to End Sexual Violence in Conflict.
- The map revealed that Pope Francis was a particularly influential person in facilitating the discussion. Pope Francis is the bright yellow area below.
- While identifying local influencers isn’t the end goal of a public diplomacy initiative, it can be an important step for gaining recognition and getting the message out to a target audience.

The network map created from the summit. An interactive version of the map can be found here.
Conclusion
Certainly, big data can’t provide all the answers. One of the biggest problems is that there’s no guarantee that the online world will be representative of a living, breathing group of people. However, the potential of big data is vast, and with more research safeguards and a better understanding of user demographics, big data can help public diplomats understand foreign audiences like never before. Learning to tap into the vast scores of information at our fingertips will be integral for public diplomats going forward.


